|
Platinum Member
Регистрация: 22.07.2010
Адрес: Санкт-Петербург
Сообщений: 3,304
|

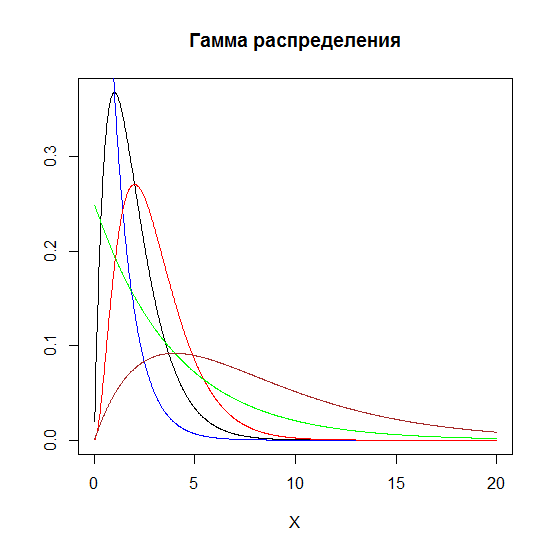
GNU R Code
Код:
X<-1:1000/50
plot(X,dgamma(X,2,1),type="l",ylab="")
lines(X,dgamma(X,1,1),col="blue")
lines(X,dgamma(X,3,1),col="red")
lines(X,dgamma(X,1,scale=4),col="green")
lines(X,dgamma(X,2,scale=4),col="brown")
title("Гамма распределения")
Help по Gamma-функции
The Gamma Distribution
Description
Density, distribution function, quantile function and random generation for the Gamma distribution with parameters shape and scale.
Usage
dgamma(x, shape, rate = 1, scale = 1/rate, log = FALSE)
pgamma(q, shape, rate = 1, scale = 1/rate, lower.tail = TRUE,
log.p = FALSE)
qgamma(p, shape, rate = 1, scale = 1/rate, lower.tail = TRUE,
log.p = FALSE)
rgamma(n, shape, rate = 1, scale = 1/rate)
Arguments
x, q
vector of quantiles.
p
vector of probabilities.
n
number of observations. If length(n) > 1, the length is taken to be the number required.
rate
an alternative way to specify the scale.
shape, scale
shape and scale parameters. Must be positive, scale strictly.
log, log.p
logical; if TRUE, probabilities/densities p are returned as log(p).
lower.tail
logical; if TRUE (default), probabilities are P[X ≤ x], otherwise, P[X > x].
Details
If scale is omitted, it assumes the default value of 1.
The Gamma distribution with parameters shape = a and scale = s has density
f(x)= 1/(s^a Gamma(a)) x^(a-1) e^-(x/s)
for x ≥ 0, a > 0 and s > 0. (Here Gamma(a) is the function implemented by R's gamma() and defined in its help. Note that a=0 corresponds to the trivial distribution with all mass at point 0.)
The mean and variance are E(X) = a*s and Var(X) = a*s^2.
|